Contact Us : 800.874.5346 International: +1 352.375.0772

The American Institute of CPAs (AICPA) releases aggregate CPA Exam pass rates quarterly after each testing window. Gleim reports these pass rates here immediately—we know you’re excited to see how the entire cohort did! The latest passing data also helps us understand how CPA Exam changes affect candidate performance, so we analyze and compare CPA Exam pass rates throughout the years. We highlight important patterns like the Golden Window and shed some light on how the AICPA calculates CPA Exam scores here, too.
If you’re a CPA Exam candidate, you will have already received your score individually in the CPA Exam score release that happens throughout the CPA Exam testing window. Now you can find here the latest overall CPA Exam pass rate for the period.
2019 CPA Exam Pass Rates |
||||||
|---|---|---|---|---|---|---|
| Section | First Quarter | Second Quarter | Third Quarter | Fourth Quarter | Cumulative | |
| AUD | 48.56% | 55.11% | 52.12% | |||
| BEC | 58.00% | 59.74% | 59.93% | |||
| FAR | 44.43% | 49.37% | 46.97% | |||
| REG | 50.23% | 58.66% | 55.17% | |||
We saw strong performances in all four sections throughout 2018, and the cumulative average pass rate soared compared to 2017 (52.43% vs. 48.31%).
Why have CPA pass rates gone up? The AICPA’s move to CPA Exam Blueprints has made it easier than ever before for CPA review providers, like Gleim, to create the materials CPA candidates rely on to pass. This, coupled with the CPA Exam’s 2018 integration of Microsoft Excel, has given today’s candidates a leg up in terms of quality of life, even though exam standards remain stringent.
We’re optimistic pass rates will remain high in 2019.
That said, trust in your own CPA Exam preparations, which can give you a passing CPA Exam score no matter the trends. You can learn more about the CPA Exam and how to secure that passing score by accessing our free CPA Exam guide today!
The CPA Exam is difficult for a reason. The certification is sought after because it is meaningful. It signals to employers and peers a certain caliber of professionalism. If the CPA Exam was easier, the market would be saturated with CPAs, many of whom would not be able to contribute at the highest level. The CPA Exam pass rate is something the AICPA is continuously monitoring to make sure accountants who earn the CPA embody its standard.
The AICPA has reported CPA Exam pass rates since 2006, and for the last 13 years, the cumulative average pass rate has mostly fluctuated between 45% and 50%.
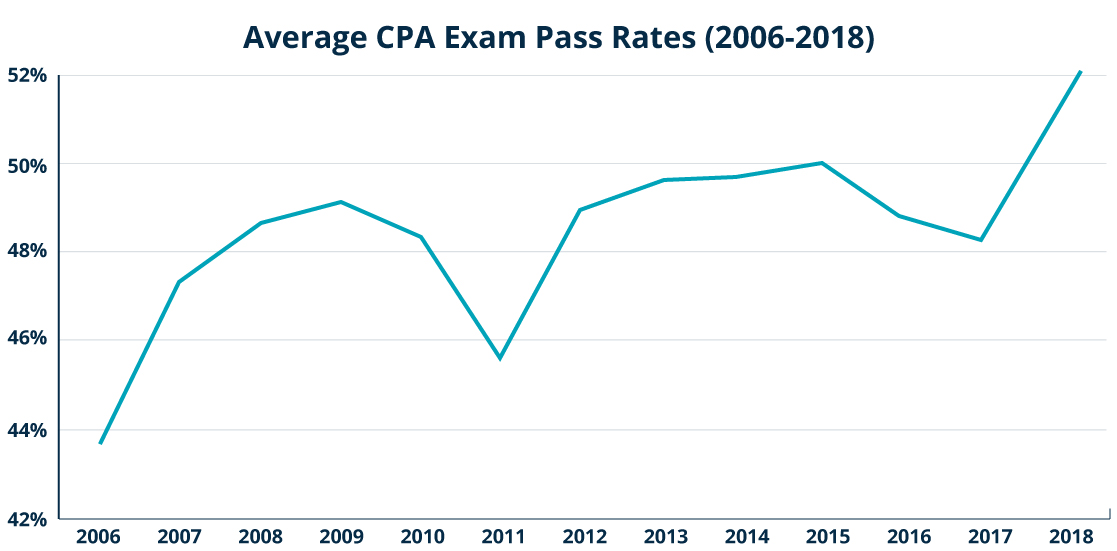
The cumulative average CPA Exam pass rate for 2018 set a record high and is a massive leap up from the previous year’s (52.43% vs. 48.31%). But this doesn’t tell us the whole story. Each of the four CPA Exam sections are taken and passed (or failed) separately, and each presents a unique set of challenges for CPA candidates.
Since 2015, the AUD and REG sections have both tended to be “middle-of-the-road” as far as CPA Exam difficulty is concerned. FAR has had the lowest pass rate for the past four years, and BEC has had the highest for eight! Now that the newest version of the CPA Exam has been out for a while (since April 2017), absent any more major shakeups, we anticipate these trends will hold.
REG is going through some changes in 2019 thanks to the Tax Cuts and Jobs Act (TCJA) that was passed at the end of 2017. Because REG deals largely with tax codes, candidates will have a lot of new rules to memorize and apply to their accounting practice. We anticipate these changes will cause a temporary dip in REG pass rates.
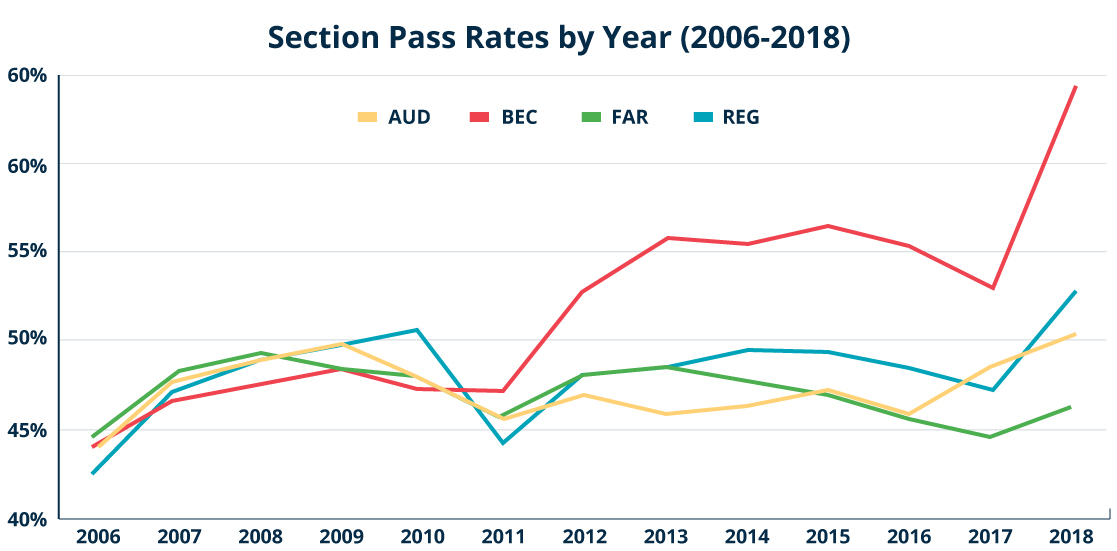
Back in 2006, CPA Exam pass rates for all four sections showed little variation. They begin to diverge in 2011 due to the massive changes the CPA Exam went through that year. In fact, 2011 boasted the biggest changes since the test was computerized in 2004; which was when the AICPA introduced testing on IFRS and removed written communication tasks from every section but BEC.
CPA Exam pass rates don’t just change from year to year, they also fluctuate a lot from quarter to quarter. We’ve studied CPA Exam pass rates closely for 45 years.
So based on the statistics, when is the best quarter to sit for the CPA Exam? Let’s take a look.
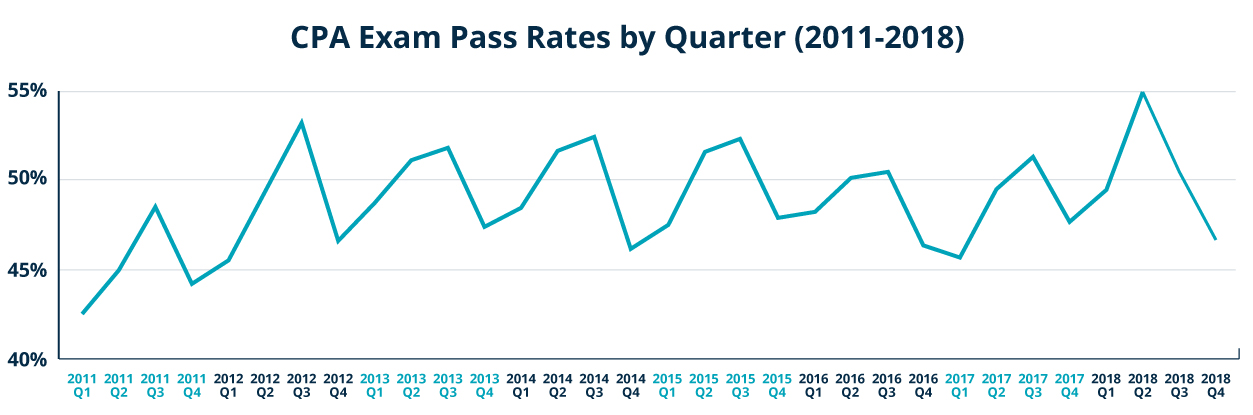
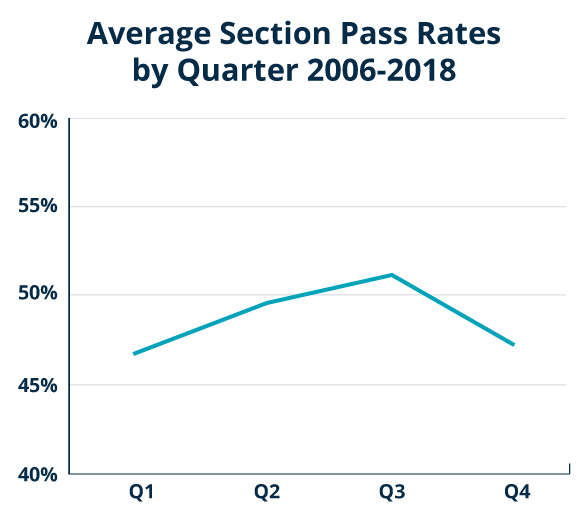
See how the pass rates rise and fall like mountains? The highs and lows always occur in the same testing windows. The “peaks” occur during Quarter 3 (Q3), followed closely by Q2, and the “valleys” occur during Q1 and Q4.
History shows that Q2 (April-June) and Q3 (July-September) are always when CPA Exam pass rates are highest. If you’re trying to work out your CPA Exam schedule, consider the “Golden Window.”
There are a lot of factors that determine pass rates: how hard the exam is, how prepared candidates are, any changes the exam is undergoing, etc. Also note: recorded pass rates for the CPA Exam only go back to 2006. The first “CPA Exam” was delivered by the New York Board of Examiners in 1896, so we’re unfortunately missing a lot of data (not that it would be useful for today’s CPA candidates). Let’s look at what affects the modern CPA candidate.
Busy season for tax accountants is from January-April, and 80% of that time falls within Q1 (January-March). People who work full-time probably find it hard to keep up with studying, so it falls by the wayside. Pair this with the fact that Q1 comes right after the holiday season, another time candidates probably find poorly suited for studying, and fewer people end up passing.
Q2 (April-May) is the first chance most college graduates have to take a CPA Exam section. They don’t have much time to study immediately after classes end, so most likely they have been studying while classes were in session. While they do pass at a high rate, they are not quite as prepared as they might have been in Q3.
Q3 (July-September) is a perfect time for college graduates to take a section of the CPA Exam. Students who graduate in May have all summer to study for the next section. There are very few holidays during that time, and many students probably want to finish so they don’t have to study during the holidays later in the year. This sets them up to do very well when they sit in Q3.
Q4 (October-December) pass rates could be low due to the holiday season, much like Q1. Recent graduates who began the testing process as a student are largely able to complete the testing process by the end of Q3, and so aren’t there to inflate pass rates come Q4.
Accounting coursework overlaps with many CPA Exam topics, so current and recent students tend to perform well on the exam.
These explanations are all conjecture. Still, walking through this reasoning is important because there are critical factors for candidates to consider outside of the CPA Exam itself. While passing still depends largely on how well prepared you are, you should still be aware of the way your environment affects you and craft your study plan in a way that gives you every possible advantage. Are you someone who, no matter how hard you try, will never get work done over the holiday season? Consider that when scheduling your exam. Learn more in our guide to scheduling the CPA Exam.
Right before the 2018 CPA Exam blueprints launched in April, the AICPA released the final set of pass rates from the old CPA Exam. The numbers show that the CPA Exam received some of its highest pass rates since the AICPA began publishing them online in 2006.
There continued to be strong performances in all four CPA Exam sections throughout 2018. The cumulative average pass rate for the year was 52.43%! A record high!
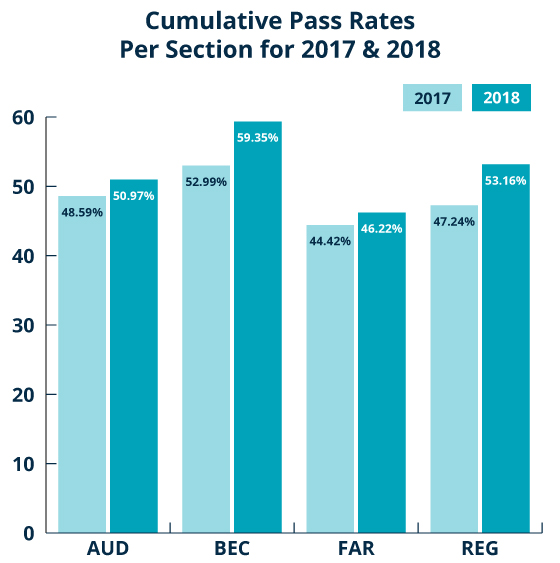
See the CPA Exam pass rates for 2018 in the chart. We’ve also analyzed the 2018 passing percentages and compared them to pass rates from previous years, including the 2017 pass rates.
| 2018 CPA Exam Pass Rates | |||||
|---|---|---|---|---|---|
| Section | First Quarter | Second Quarter | Third Quarter | Fourth Quarter | Cumulative |
| AUD | 49.27% | 54.70% | 51.07% | 48.54% | 50.97% |
| BEC | 56.43% | 60.31% | 60.17% | 60.13% | 59.35% |
| FAR | 41.59% | 49.17% | 48.85% | 44.57% | 46.22% |
| REG | 49.99% | 55.75% | 56.55% | 50.22% | 53.16% |
Pass rates tend to rise in Q2 and Q3. We saw record-high passing data in Q2, and Q3 numbers decreased slightly overall, excluding REG, but scores remained high.
Even though FAR’s figures were historically low during Q1, it achieved one of its highest pass rates ever in Q2 after the 2018 Blueprint update. In Q3, FAR scores fell again, though they decreased by only 0.8%.
Even in Q4, when scores usually fall back down to Q1 levels, we saw much higher averages.
We’re likely seeing higher FAR scores because the integration of Microsoft Excel has made FAR’s multiple-choice question calculations much smoother. This bodes well for future candidates and explains the strong pass rates we’re seeing.
We’re taking a close look at 2018 because it’s the first time we have an entire year of data for the new CPA Exam version that launched in April 2017.
Auditing and Attestation (AUD)
The Q1 2018 pass rate was 49.27%
The Q2 2018 pass rate was 54.70%
The Q3 2018 pass rate was 51.07%
The Q4 2018 pass rate was 48.54%
Financial Accounting and Reporting (FAR)
The Q1 2018 pass rate was 41.59%
The Q2 2018 pass rate was 49.17%
The Q3 2018 pass rate was 48.85%
The Q4 2018 pass rate was 44.57%
Business Environment and Concepts (BEC)
The Q1 2018 pass rate was 56.43%
The Q2 2018 pass rate was 60.31%
The Q3 2018 pass rate was 60.17%
The Q4 2018 pass rate was 60.13%
Regulation (REG)
The Q1 2018 pass rate was 49.99%
The Q2 2018 pass rate was 55.75%
The Q3 2018 pass rate was 56.55%
The Q4 2018 pass rate was 50.22%
We witnessed a jump in pass rates and saw multiple records set, likely due in part to the user experience improvements made by the AICPA at the beginning of Q2 2018. But there’s no question: passing the exam is hard. Even with some sections hitting record high pass rates, the total pass rate for the CPA Exam in 2018 remains 52.43%. A record high for the CPA Exam, but it still means that nearly half of all candidates don’t pass.
The user experience improvements may mean pass rates will permanently be a little higher. Or, the AICPA could influence the pass rates by increasing the difficulty of the CPA Exam to compensate. The AICPA explains that pass rates are low because it protects the public by ensuring CPAs are competent. Additionally, when pass rates are low, the CPA certification remains prestigious. There’s a limited supply of CPAs, so organizations and individuals in need of one have to come prepared to pay a premium.
Whether or not pass rates stay high, the exam still rewards candidates who prepare. Whatever the future holds, Gleim CPA Review can help you meet your career goals.
With the launch of a new CPA Exam version and a delayed score release, 2017 was a momentous period in CPA Exam history. The cumulative average pass rate for 2017 was 48.31%, but that only tells us part of the story.
The new version of the CPA Exam wasn’t released until April, so it’s useful to consider the 2017 cumulative average pass rate using only Q2-Q4 data, which was 49.58%. This might make it seem as though the new version of the exam was easier, but when you account for the fact that Q1 pass rates are typically much lower than those of Q2 and Q3, it appears the opposite is true: the new 2017 version of the CPA Exam was, on the whole, harder for candidates than the older version.
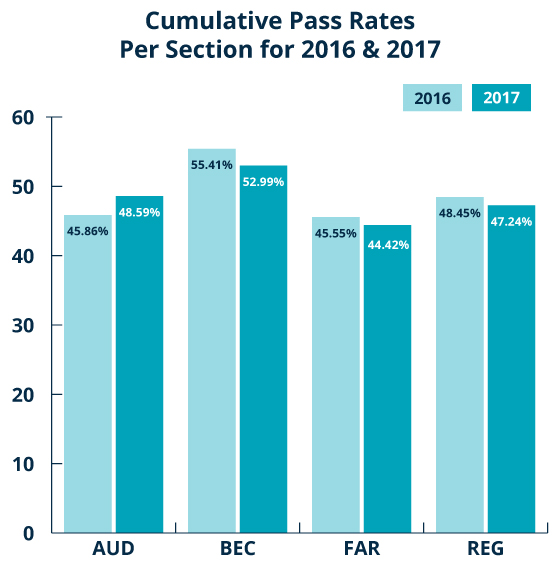
We’ve analyzed the 2017 pass rates and compared them to the 2016 CPA Exam pass rates so we can try to understand how the new exam version has affected CPA candidates.
| Uniform CPA Examination Pass Rates 2017 | |||||
|---|---|---|---|---|---|
| Section | First Quarter | Second Quarter* | Third Quarter* | Fourth Quarter* | Cumulative |
| AUD | 43.47% | 52.00% | 52.15% | 47.69% | 48.59% |
| BEC | 50.39% | 55.09% | 55.35% | 55.33% | 52.99% |
| FAR | 43.14% | 43.76% | 47.58% | 42.50% | 44.42% |
| REG | 46.10% | 48.32% | 49.31% | 45.89% | 47.24 |
*Please note: The 2017 Q2, Q3, and Q4 pass rates reflect those of a CPA Exam with a new passing standard. Comparisons to past years and quarters are of limited value due to the changes made to the Exam in April 2017. The AICPA Board of Examiners regularly monitors pass rates.
The cumulative average pass rate for Q1 2017 was 45.78%.
The cumulative average pass rate for Q2 2017 was 49.79%.
The cumulative average pass rate for Q3 2017 was 51.10%.
The cumulative average pass rate for Q4 2017 was 47.85%.
Overall, with the exception of the BEC Q4 and AUD Q2, Q3, and Q4 2017 pass rates, the 2017 pass rates were lower than those of 2016.
Therefore, as expected, the new version of the exam seemed to be more challenging than the previous version. Going off of just the Q2, Q3, and Q4 2017 CPA Exam pass rates, the FAR CPA Exam section remained the most challenging and BEC was still the least challenging, but as AUD demonstrated with its Q2 and Q3 shockers, the new version of the CPA Exam is challenging candidates’ expectations.
A possible explanation for the spike in AUD performance is what happened in 2016: thousands more candidates than usual sat for the exam in an attempt to pass before the CPA Exam changed in April 2017. The AUD section saw the greatest jump in attempts. Because of that, pass rates for AUD plummeted. It’s possible that some of the 2017 increase is due to retakes.
With the launch of a new CPA Exam version slated for April 2017, thousands more candidates than usual decided to sit for the CPA Exam before it changed. 2016 is the last full year of data we have for the old version, which remained relatively stable after the 2011 CPA Exam changes.
The cumulative average pass rate for 2016 was 48.82%. We’ve analyzed the 2016 numbers to see how the influx of candidates affected pass rates.
| 2016 CPA Exam Pass Rates | |||||
|---|---|---|---|---|---|
| Section | First Quarter | Second Quarter | Third Quarter | Fourth Quarter | Cumulative |
| AUD | 44.87% | 48.70% | 45.30% | 44.41% | 45.86% |
| BEC | 55.40% | 56.33% | 57.55% | 52.87% | 55.41% |
| FAR | 44.74% | 45.61% | 48.07% | 43.24% | 45.55% |
| REG | 47.55% | 49.98% | 50.19% | 45.93% | 48.45% |
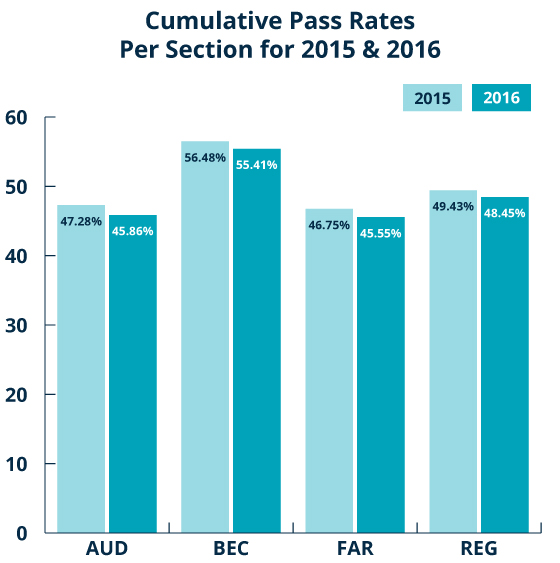
According to NASBA, a total of 102,323 candidates sat for 268,933 sections of the CPA Exam in 2016. The total number of candidates for 2016 is significantly higher than for 2015, which saw 93,693 candidates sit for the exam. Not only did almost 9,000 more candidates sit in 2016, but the group of unique candidates who started the CPA Exam process in 2016 was larger than the group that began in 2015. Clearly, the April 2017 launch of the new CPA Exam version compelled more candidates than usual to take on the exam in 2016.
More candidates means more section attempts, which can contribute to lower pass rates if those candidates are under-prepared. That was certainly the case in 2016, because many candidates were rushing to complete the process before the April 2017 CPA Exam changes.
In 2016, CPA Exam candidates attempted AUD more than any other section, with 70,449 overall attempts. AUD consequently had the second lowest Q4 pass rate and the second lowest cumulative pass rate.
Of the 268,933 exam sections attempted, 157,655 were first attempts, and demonstrated higher pass rates than repeat attempts for the same section. Candidates passed first attempts at a rate of 54.4%, while they only passed repeat attempts 40.7% of the time. Furthermore, the candidates who sat for and passed an exam section the first time they attempted it were younger than those who sat for the same section again. The average age of first attempt candidates was 27.8, and the average age of repeat attempt candidates was 30.4. This result demonstrates that candidates can prepare adequately enough to pass an exam section the first time and that they are more likely to do so when they take the exam closer to graduation.
The CPA Exam is difficult for a reason. The CPA certification is sought after because it is meaningful, and it is only meaningful because of how difficult it is to acquire. It signals to employers and peers a certain caliber of professionalism. If the CPA Exam were easier, the market would become saturated with CPAs, many of whom would not be able to contribute at the highest level. The CPA Exam pass rate is something the AICPA is continuously monitoring to make sure accountants who earn the CPA embody its standard.
But whatever the pass rates are, they don’t have to define your chances of success. The best thing you can do to ensure you pass on your first attempt is to have a solid CPA review provider by your side when you sit for the exam. Each candidate who chooses to study with Gleim CPA Review has access to a team of Personal Counselors who can help you create a personalized study plan and will walk you through each step of the exam process. With SmartAdapt™ technology at your side, you’ll be on the path to success.
Passing the CPA Exam is one of the four requirements to become a CPA. It is designed to measure professional competence in auditing, business law, taxation, and accounting. The AICPA’s goal is for every candidate who passes the exam with the minimum passing score of 75 to reflect positively on the profession.
To that end, the exam also tests related business skills, the ability to conduct oneself skillfully and with good judgment, and understanding of professional responsibilities and ethics. Passing this exam confirms you have the competence to practice in a highly specialized field.
The AICPA contracts with third parties to produce multiple-choice questions (MCQs), task-based simulations (TBSs), and written communications (WCs). Exam questions are created and vetted by experts in the fields of accounting, psychometrics, and test development.
Through the development process, these experts ensure that testlets and exam versions will be graded and scored equitably on a comparative basis. The AICPA is ultimately responsible for the creation and maintenance of the CPA Exam.
The CPA Exam is administered at Prometric test centers in partnership with the National Association of State Boards of Accountancy (NASBA). After you apply to your state board of accountancy, you will schedule and sit for your exam with Prometric.
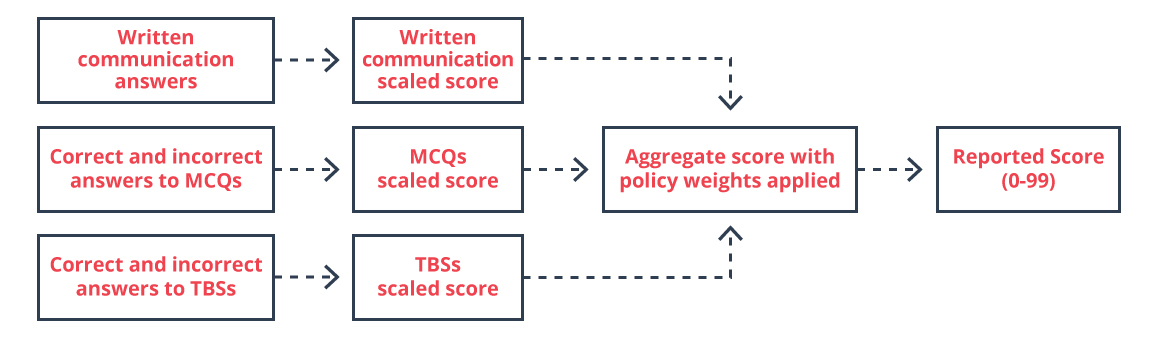
The CPA Exam is scored in a largely automated process. MCQs, TBSs, and WCs are all graded electronically; however, WCs may be reviewed and regraded by human scorers if a candidate’s score is very close to 75. The human grading process can push the release of a BEC score back by a week or so.
The minimum CPA Exam passing score is 75 points, but that doesn’t necessarily mean you need to answer 75% of questions correctly in order to pass.
The CPA Exam is what is known as a criterion-referenced test, which means every candidate’s performance is measured against established standards to determine whether the candidate has demonstrated the level of knowledge and skill represented by the CPA passing score.
The CPA Exam is not curved in the traditional sense. Every candidate is held to the same standard. The AICPA uses Item Response Theory (IRT) to figure out the relative value of MCQs and TBSs. It rates questions according to three statistics:
The calibration for the automatic grading of WCs is done using the input from a network of volunteer CPA readers. This process ensures that scores from different exam forms are comparable. Again, if a candidate’s BEC score is close to 75, WCs may be rescored by human graders.
Using the collected data, the AICPA is able to extrapolate scores from different exam forms that accurately represent candidates’ knowledge and skill levels. These scores are comparable because, to put it simply, difficult questions are worth more points and easier questions are worth fewer. It is entirely possible for two candidates to answer the same number of questions correctly and have slightly different scores.
The scores from each testlet are then multiplied by the policy weights:
Finally, the aggregate score is mapped to the 0 to 99 scale used for score reporting.
The AICPA Board of Examiners sets the CPA passing score by considering historical trends, changes in content, input from the academic community and profession, and other sources. The score is set such that a candidate who passes with the lowest possible score will reflect positively upon the professional community. Anyone who scores a 75 or higher is capable of performing the duties of a newly minted CPA.
The CPA Exam is administered in four testing windows throughout the year, and the AICPA regularly sets four CPA Exam score release dates per window. For the most part, you can expect your score a few weeks to a month after you sit for the exam.
When your CPA Exam score release date arrives, there are two ways to get your score:
The AICPA does not release sub-scores by content area, but it does report “weaker,” “comparable,” and “stronger” performances. Exercise caution when interpreting your content area performance, because these sub-scores are calculated using a relatively small number of questions.
For example, in REG, 10-20% of your exam will be on “Ethics, Professional Responsibilities and Federal Tax Procedures.” If your exam only contains 10% of questions on that topic, that’s about 8 multiple-choice questions and maybe a TBS. It’s useful to know how you did, but we don’t advise drawing conclusions about your mastery of the topic based on such a small sample size.
If you fail a CPA Exam section, don’t panic. We have steps to get you back on track on our blog.
If you decide to retake any section of the exam, we recommend you go through all of the material again at least once. A lot of time can pass between attempts, and it is best to keep the material fresh in your mind.
Read more about how to improve your CPA Exam score!